
Listing your property
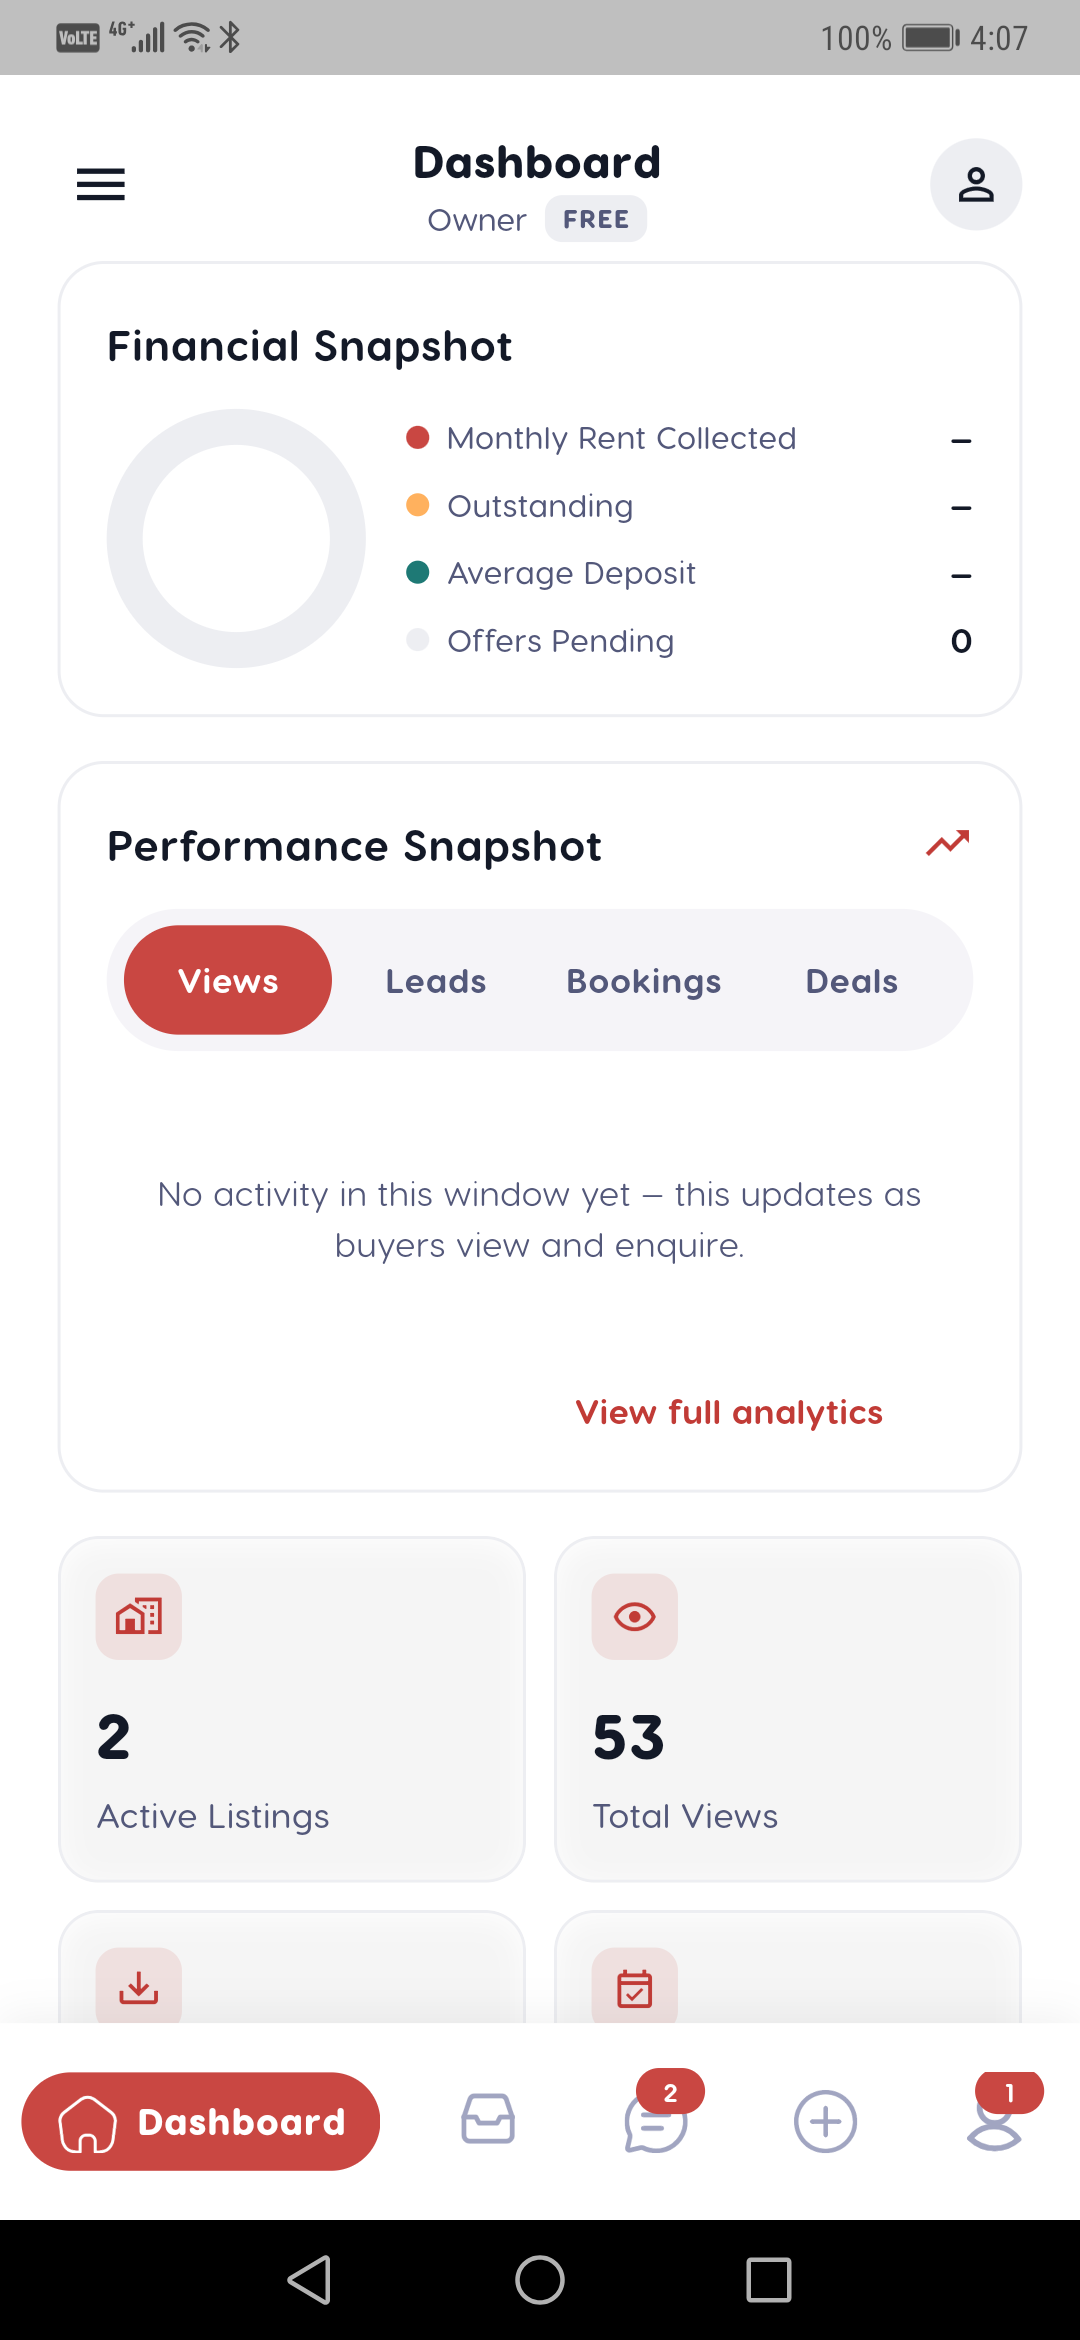
Performance snapshot
A 90-day, four-series view of how a listing is performing over time.
Last updated 2026-07-21
Where the Performance Dashboard shows the current state of every listing, the Performance snapshot shows the trend — how one listing has moved over the last 90 days.
The four series
For any listing, the snapshot charts four series over your chosen window (up to 90 days):
- Views — impressions of the listing over time.
- Leads — enquiries generated.
- Bookings — tour and viewing requests.
- Saves — how many house-hunters bookmarked it.
Read the shape, not just the totals: a spike after a promotion or a new Amplify video tells you what's working; a flat line tells you it's time to refresh the listing.
Where the numbers come from
The snapshot is built on Liivra's product analytics, aggregated per listing. It reflects real house-hunter activity — views, enquiries, tour requests, and saves — attributed to the owner's listing.
The snapshot focuses on the four demand signals above. A per-source traffic breakdown isn't part of this view — use the totals and trend to decide your next move.
The snapshot is available to agents on any plan and sits alongside the listing in your dashboard.
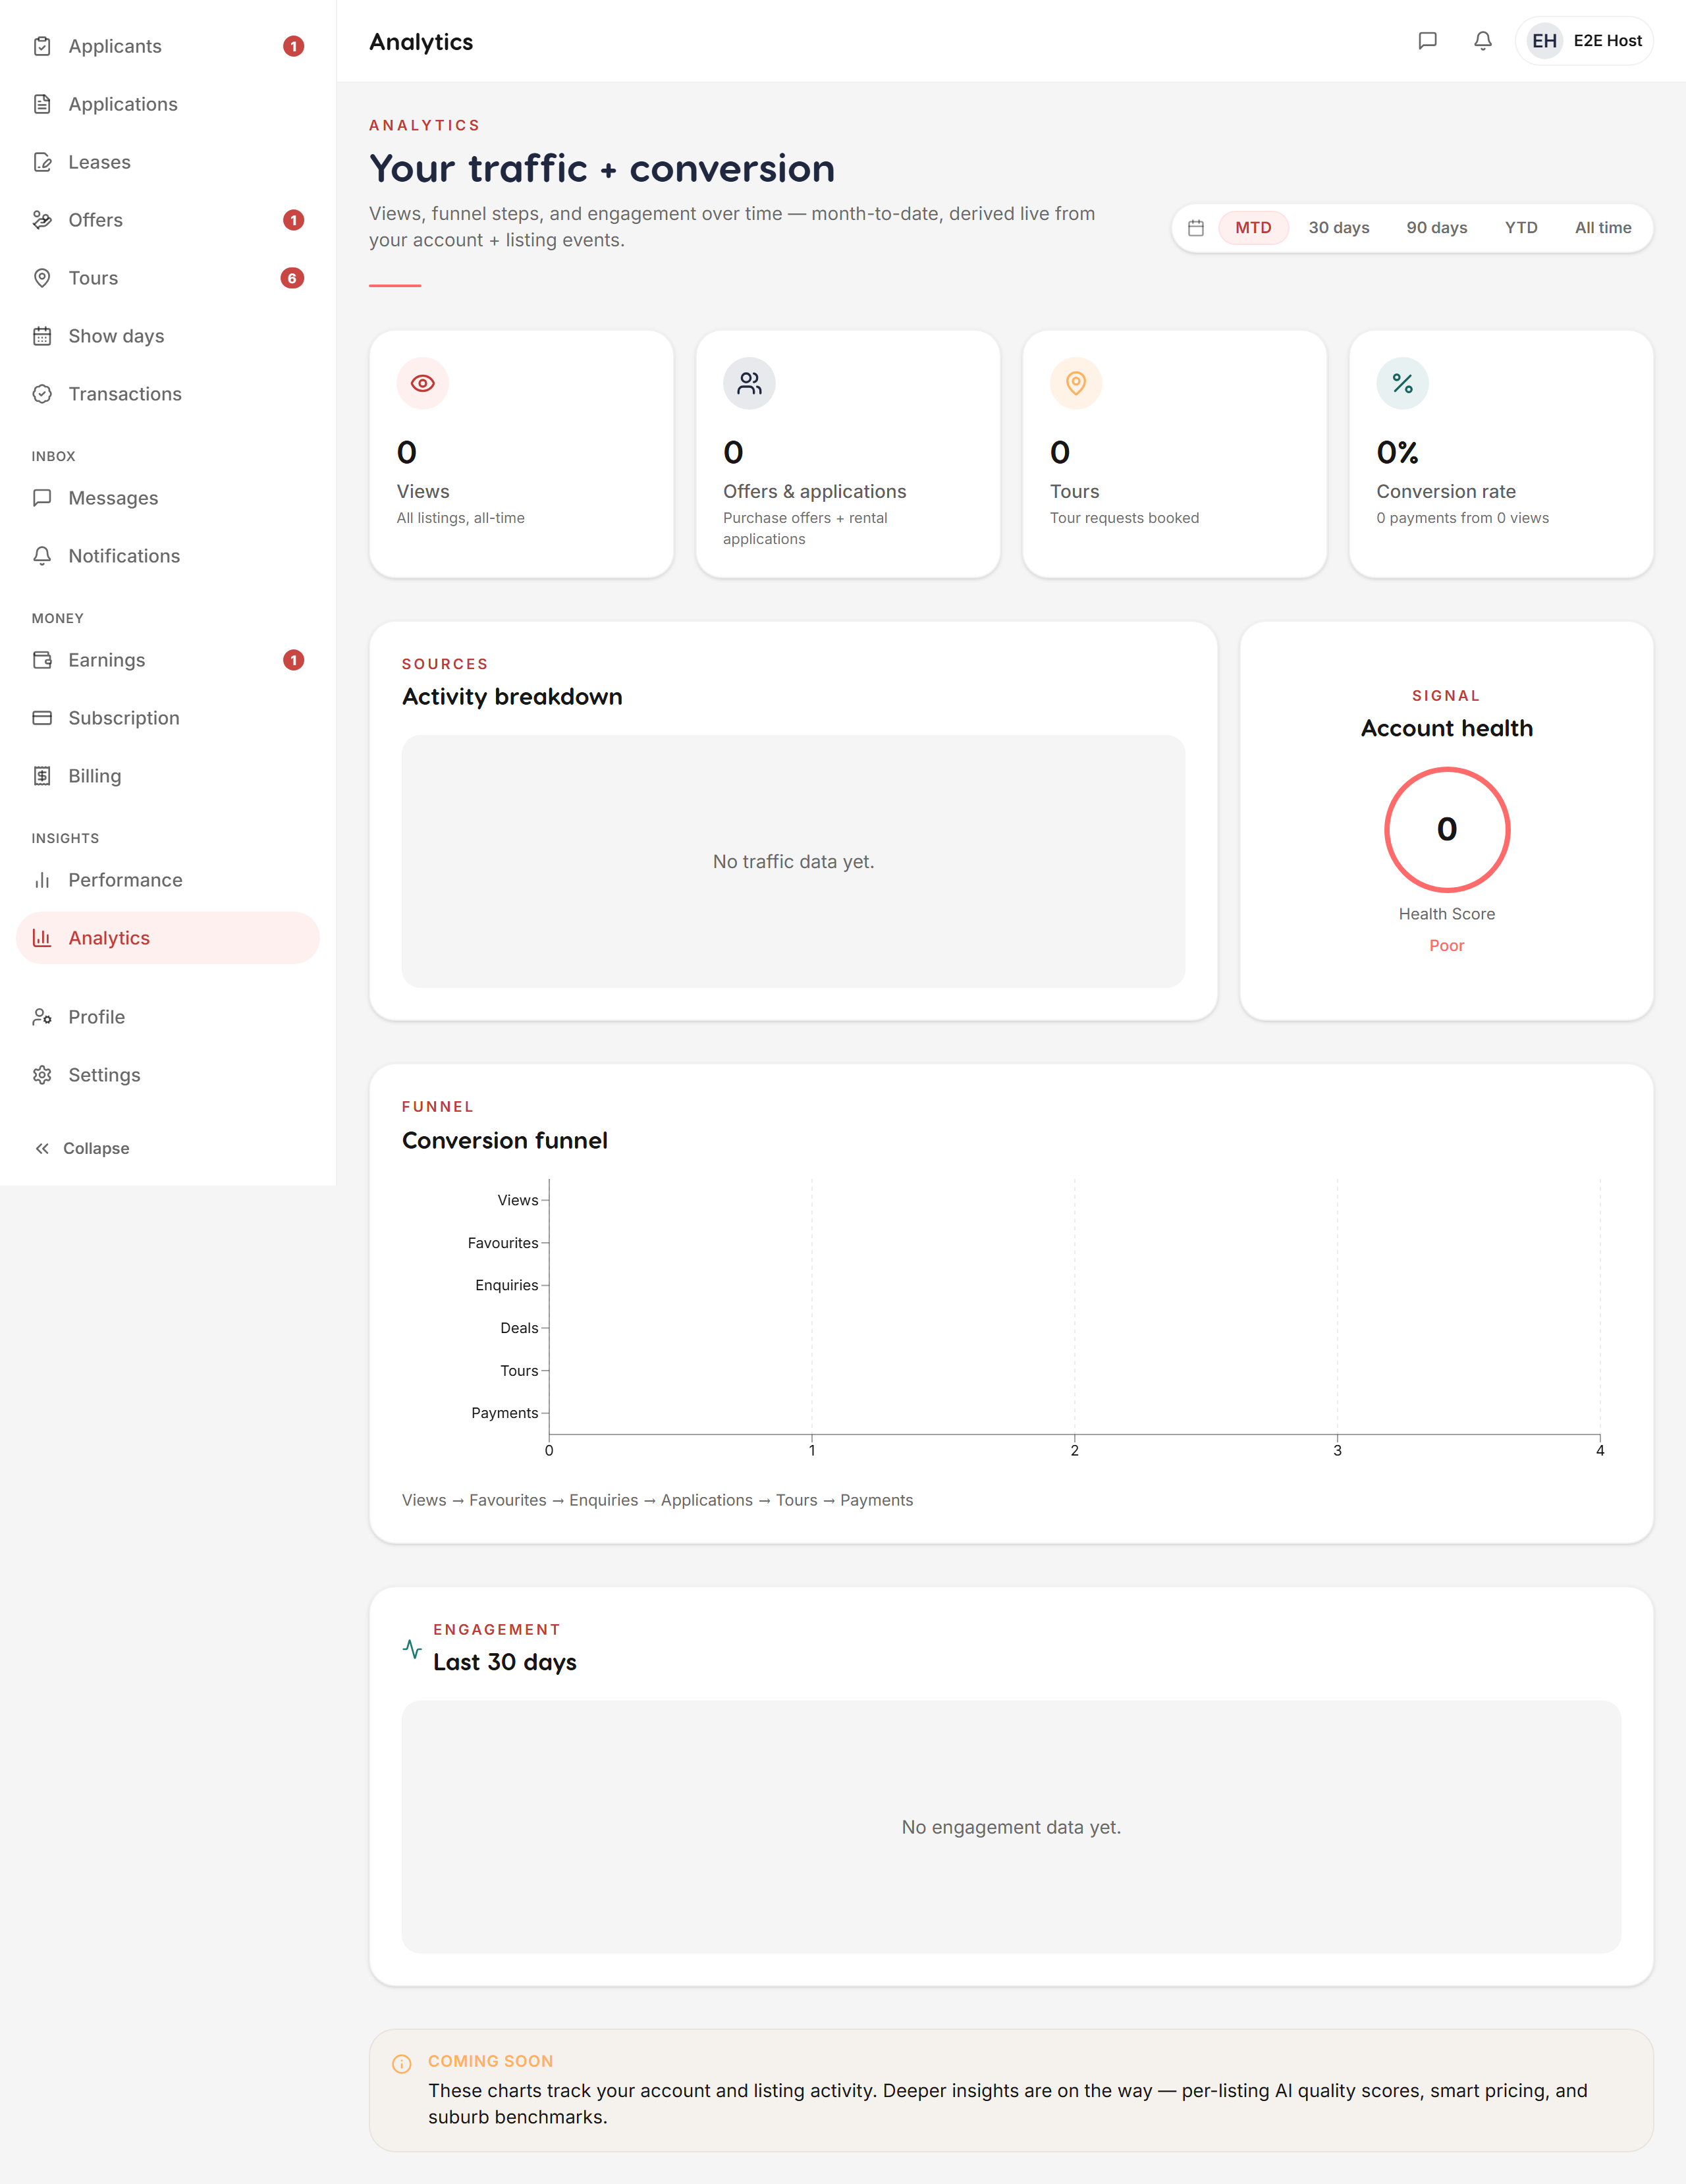
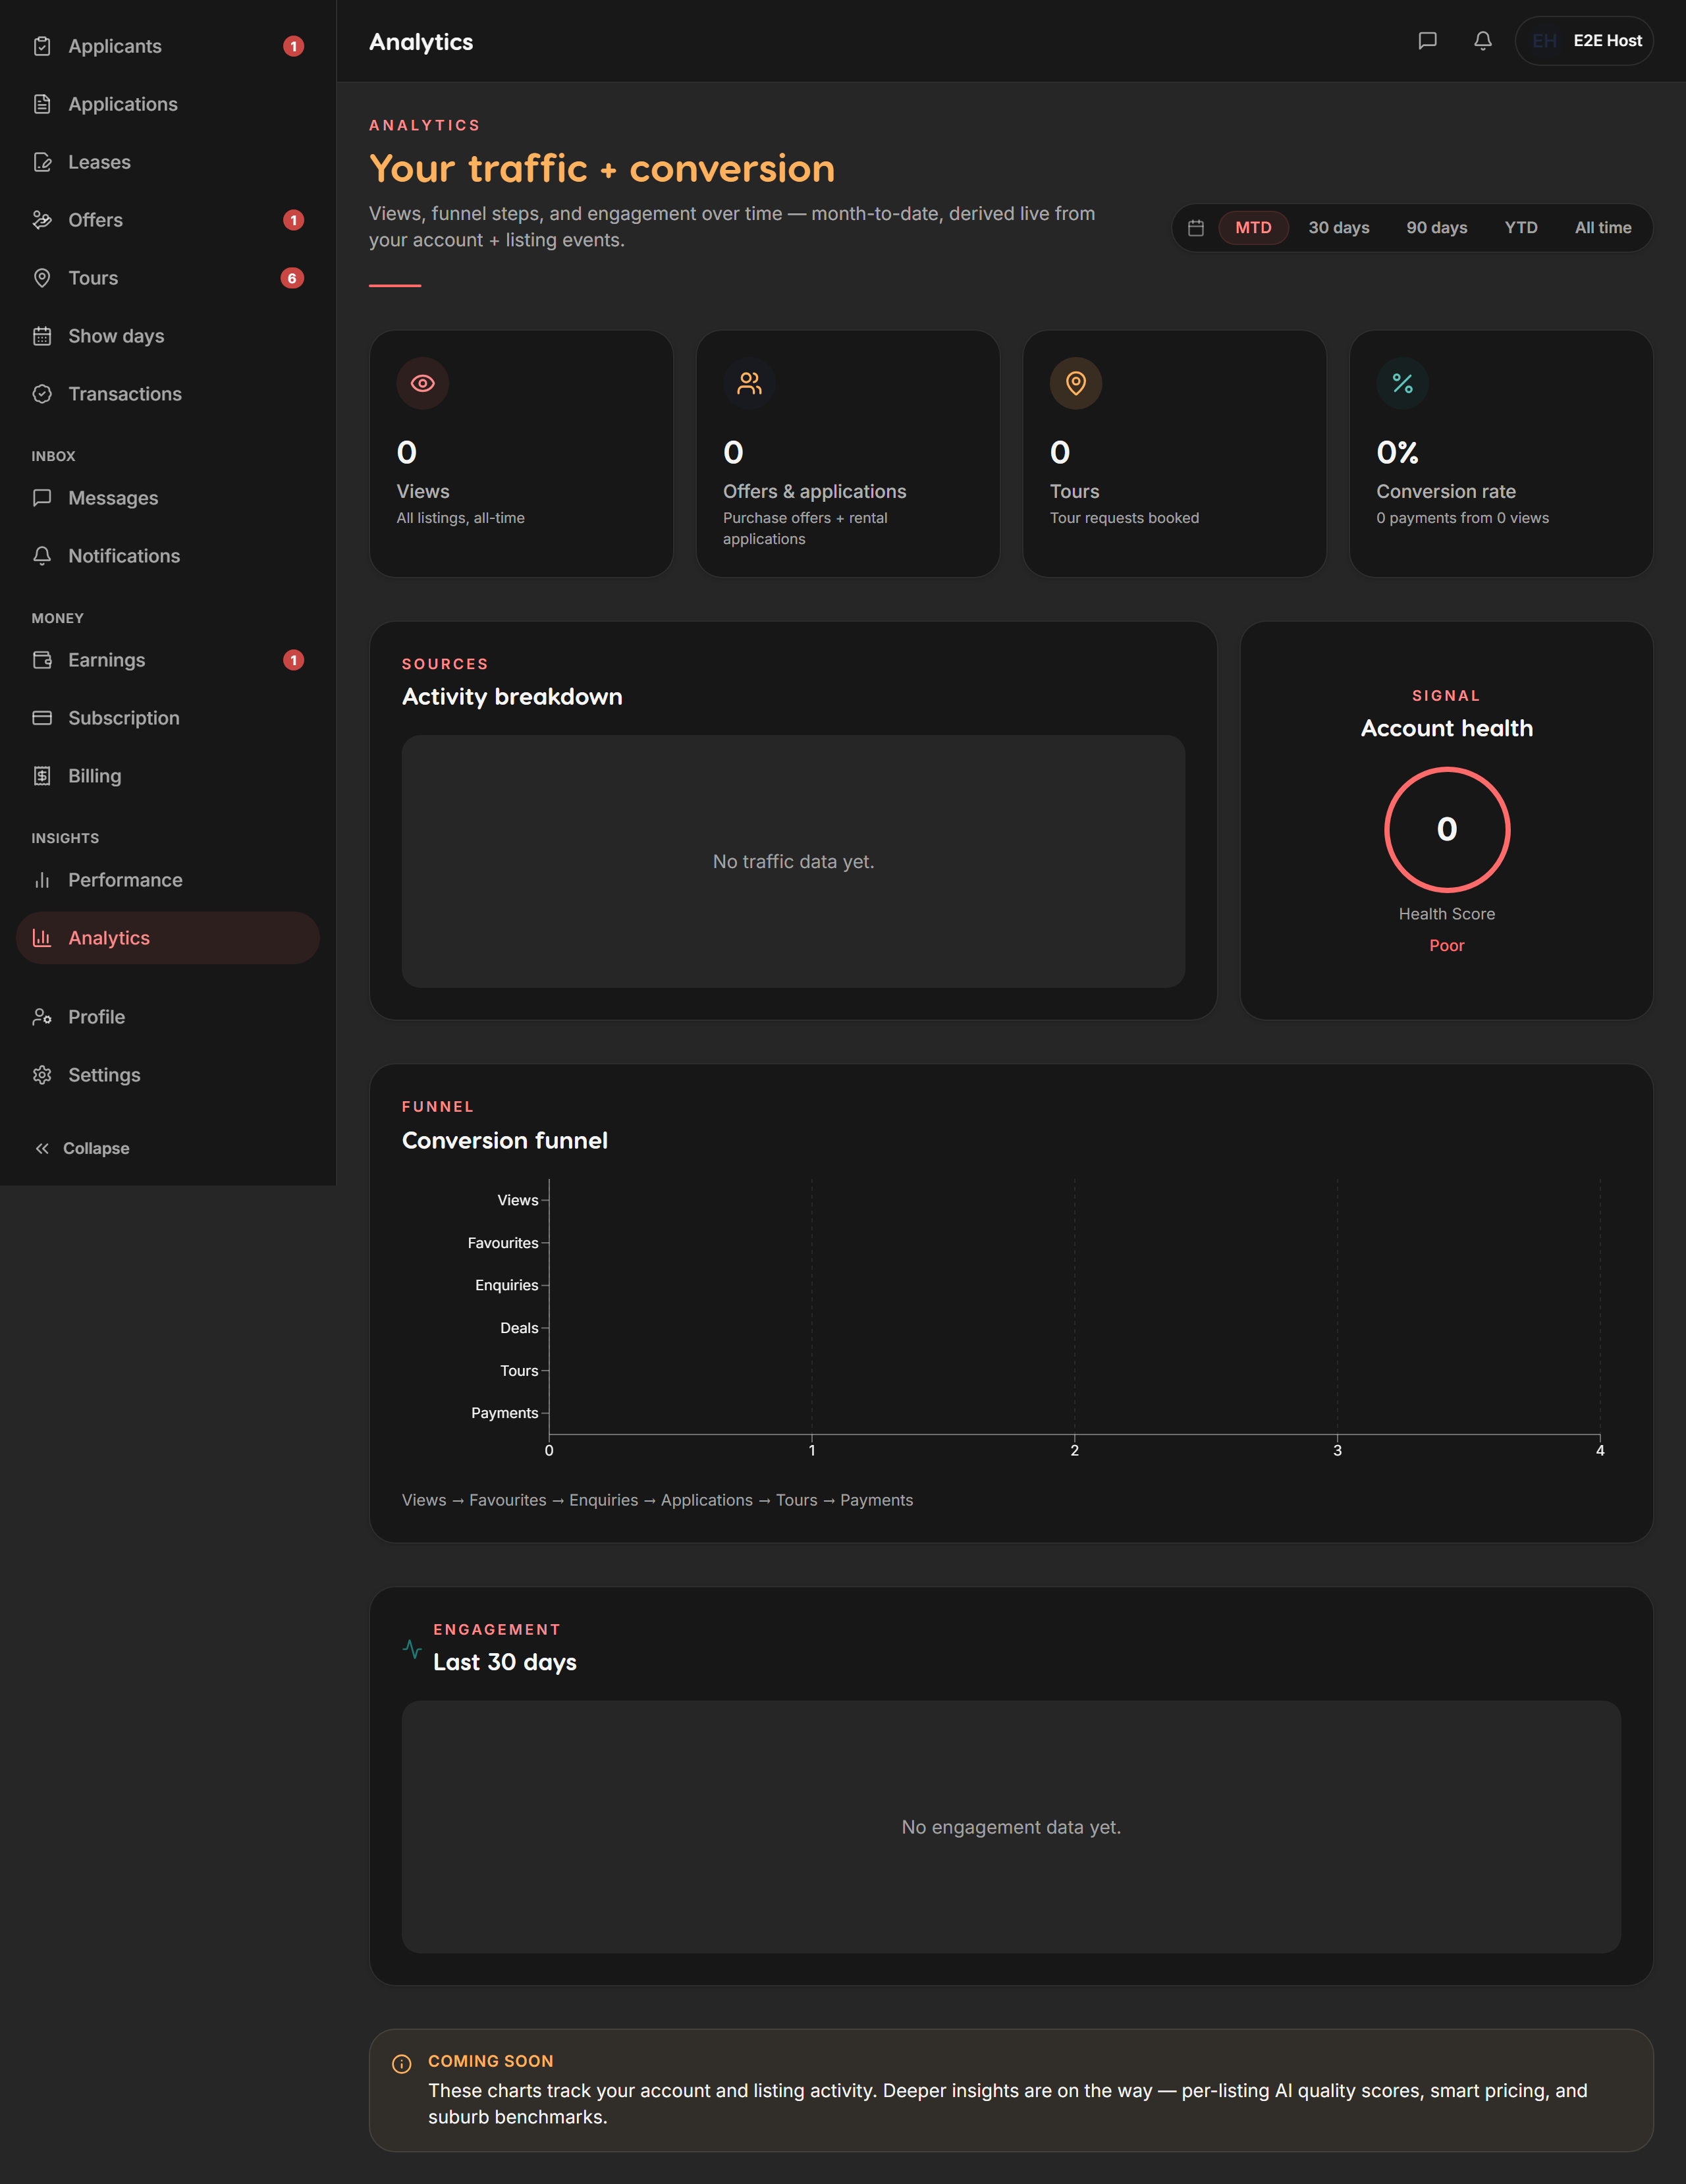
Screenshots
Captured from the live Liivra web app.
On mobile
The same screens in the Liivra iOS & Android app.